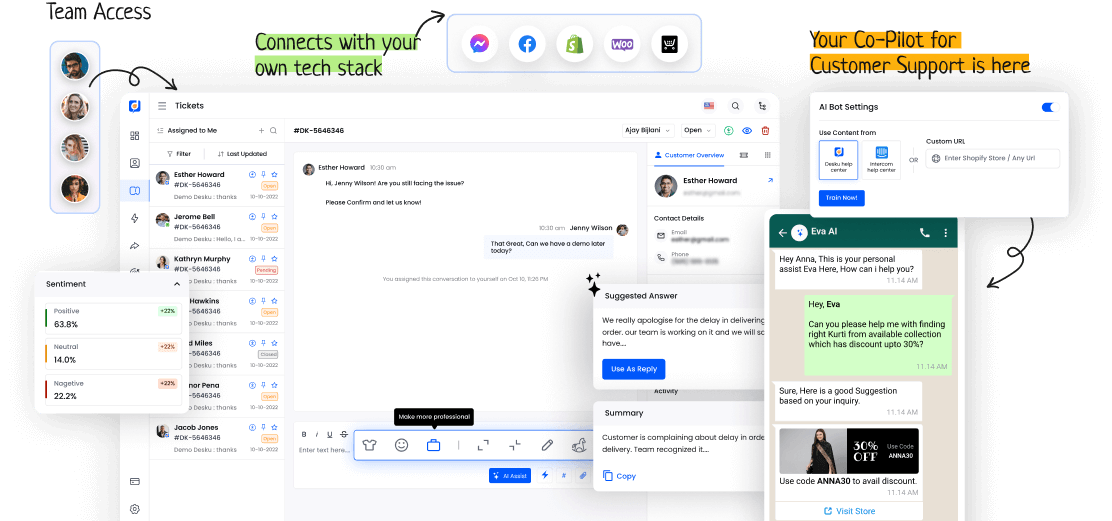
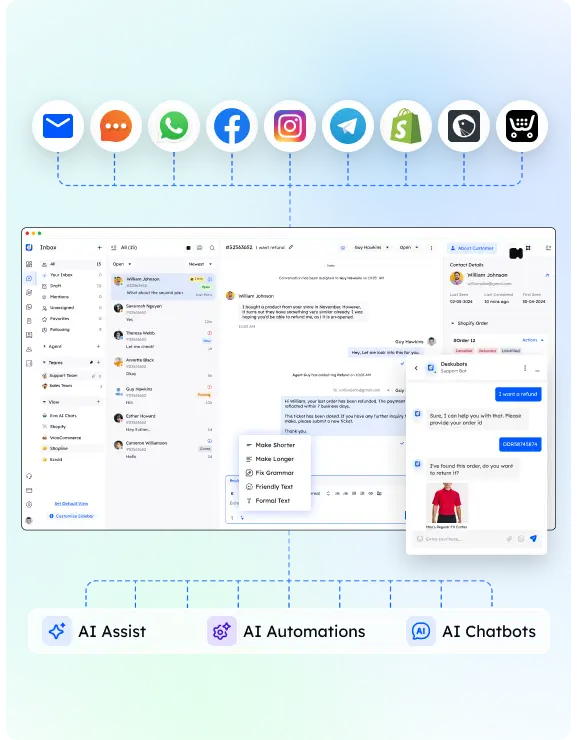
In data management, the term 'dashboard' stirs interest. It's a central platform for data visualization and analysis. Dashboards are key in business today.
But, they are more than just visuals. To grasp their impact, we need to delve into their details, functions, and uses.
I. Understanding the Concept of Dashboard
Without a doubt, dashboards are key tools. They help visualize complex data sets. This is useful in many industries. They streamline the decision-making process.
Dashboard design aims to make user-friendly interfaces. These allow for efficient data visualization. Users can interpret information easily thanks to intuitive layouts and interactive elements. They can spot trends and make informed decisions.
This design approach boosts productivity. It also helps to communicate insights from data analysis clearly.
II. Importance and Functionality of Dashboards
Dashboards hold a key role in giving a full view of data insights. They guide decision-making in many industries. Their worth lies in offering real-time updates, visual data, and vital performance measures.
Dashboards let users watch metrics easily, follow progress, and spot trends quickly. In short, dashboards improve work output, aid data-guided plans, and make processes smoother for improved results.
III. Types and Examples of Dashboards
Proceeding from our talk on dashboards' significance and function, we must now delve into their various types and illustrations. Dashboards come in styles like strategic, operational, and analytical, each catering to distinct needs.
Examples are dashboards for sales, marketing, and finance. Using charts and graphs for visualization, along with good design practices, enhances these dashboards' efficiency.


